Performance and Financial Data
Please follow the link to review our performance data: Spellbrook CofE Primary School
Financial Benchmarking can be found by following this link: Financial Benchmarking and Insights Tool DFE
Key Stage 2 Results – Summer 2024
Please see the table below
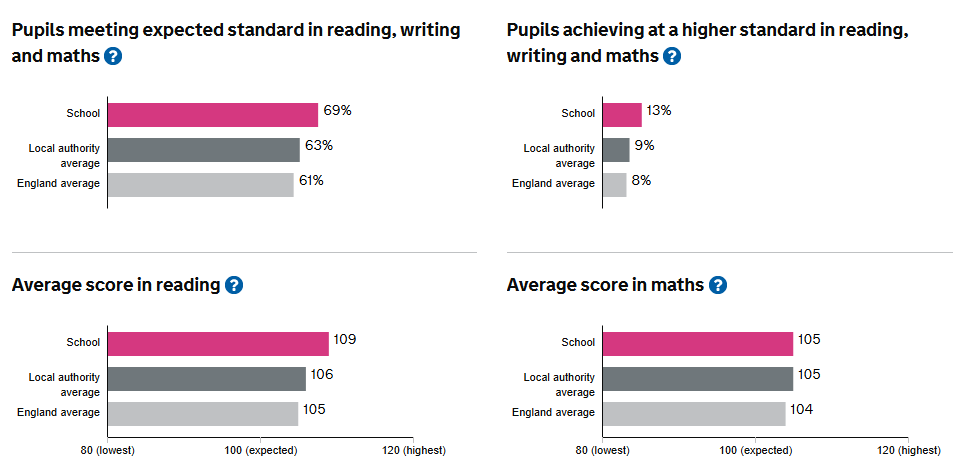
Percentage at Expected Level and Above
|
Maths |
Reading |
Writing |
Grammar, Punctuation and Spelling |
Science |
RWM combined |
|
|---|---|---|---|---|---|---|
|
Spellbrook |
87.5% |
87.5% |
68.8% |
68.8% |
81.3% |
68.8% |
|
East Hertfordshire |
75.7% |
79.1% |
72.4% |
76.0% |
|
62.6% |
|
National |
73.1% |
74.2% |
71.8% |
72.2% |
81% |
60.6% |
Percentage at Higher Level
|
Maths |
Reading |
Writing |
Grammar, Punctuation and Spelling |
Science |
RWM combined |
|
|---|---|---|---|---|---|---|
|
Spellbrook |
31.2% |
43.7% |
25% |
56.6% |
NA |
12.5% |
|
East Hertfordshire |
27.7% |
32.5% |
16.4% |
36.5% |
NA |
9.8% |
|
National |
23.8% |
28.5% |
12.9% |
31.9% |
NA |
7.6% |